stats
- class snippets.stats.GaussianKernelDensity(bandwidth: float | str | None = None, bounds: ndarray | None = None)
Gaussian kernel density estimator.
The implementation employs
gaussian_kdeto facilitate more sophisticated kernel covariances than supported byKernelDensitywhich only admits isotropic kernels.- Parameters:
bandwidth – Bandwidth selection method or scalar factor (see
gaussian_kdefor details).bounds – Array of lower and upper bounds for each dimension (use
nanfor unbounded or semi-bounded domains). Test samples are reflected at the supplied boundaries as part ofscore_samples()to account for probability mass that has “leaked out of” the support (see Boneva et al. (1971) for details).
Example
from matplotlib import pyplot as plt
import numpy as np
from sklearn.neighbors import KernelDensity
from snippets.stats import GaussianKernelDensity

fig, axes = plt.subplots(2, 2, sharex="row", sharey="row")

# One-dimensional bounds.
x = np.random.uniform(0, 1, (10_000, 1))
kdes = [
    GaussianKernelDensity(),
    GaussianKernelDensity(bounds=[0, 1]),
]
lin = np.linspace(0, 1)
for ax, kde in zip(axes[0], kdes):
    kde.fit(x)
    ax.plot(lin, np.exp(kde.score_samples(lin[:, None])))

# Two-dimensional bounds.
x = np.random.uniform(0, 1, (10_000, 2))
kdes = [
    GaussianKernelDensity(),
    GaussianKernelDensity(bounds=[[0, 1], [0, 1]]),
]
lin = np.linspace(0, 1)
xx, yy = np.meshgrid(lin, lin)
xy = np.stack([xx, yy], axis=-1).reshape((-1, 2))
for ax, kde in zip(axes[1], kdes):
    kde.fit(x)
    score = kde.score_samples(xy).reshape(xx.shape)
    im = ax.imshow(np.exp(score), extent=(0, 1, 0, 1))
    fig.colorbar(im, ax=ax)
(
Source code,png,hires.png,pdf)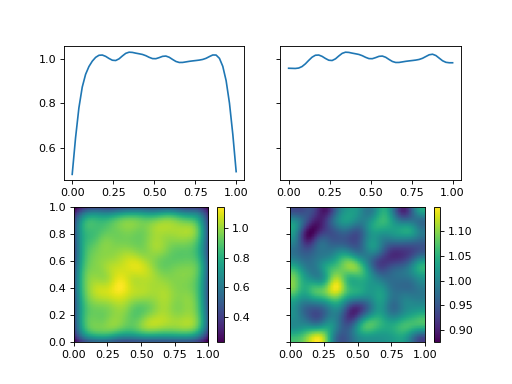